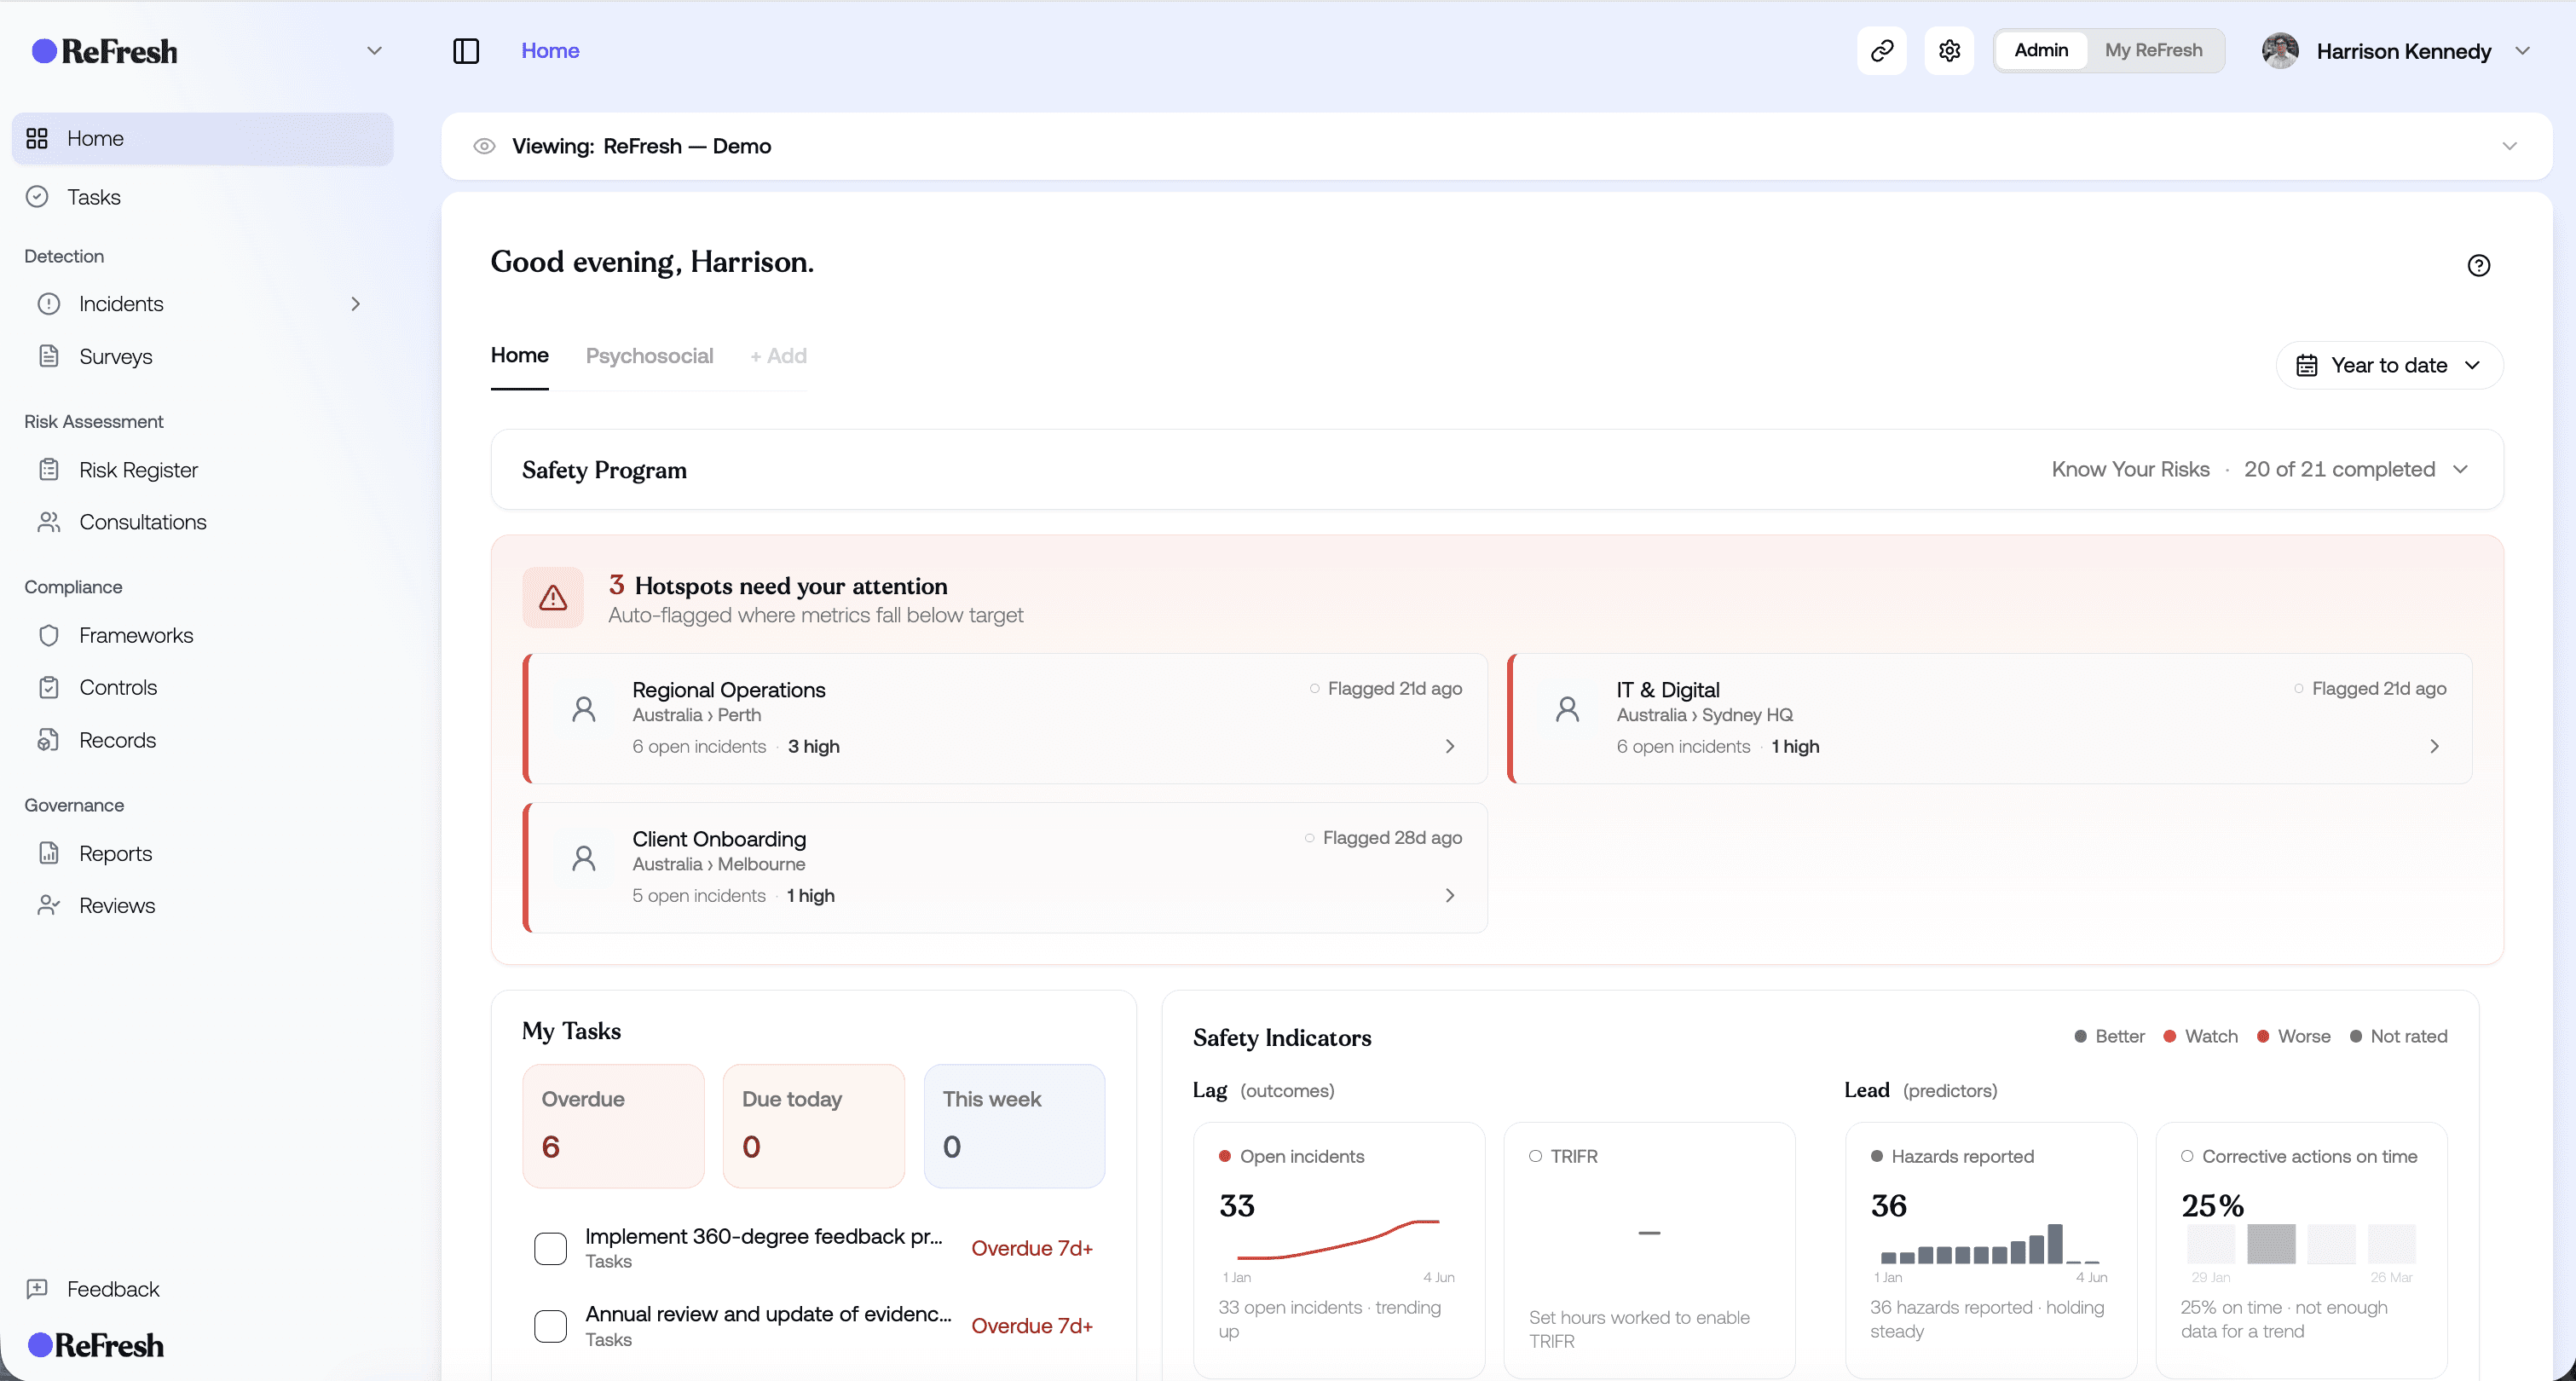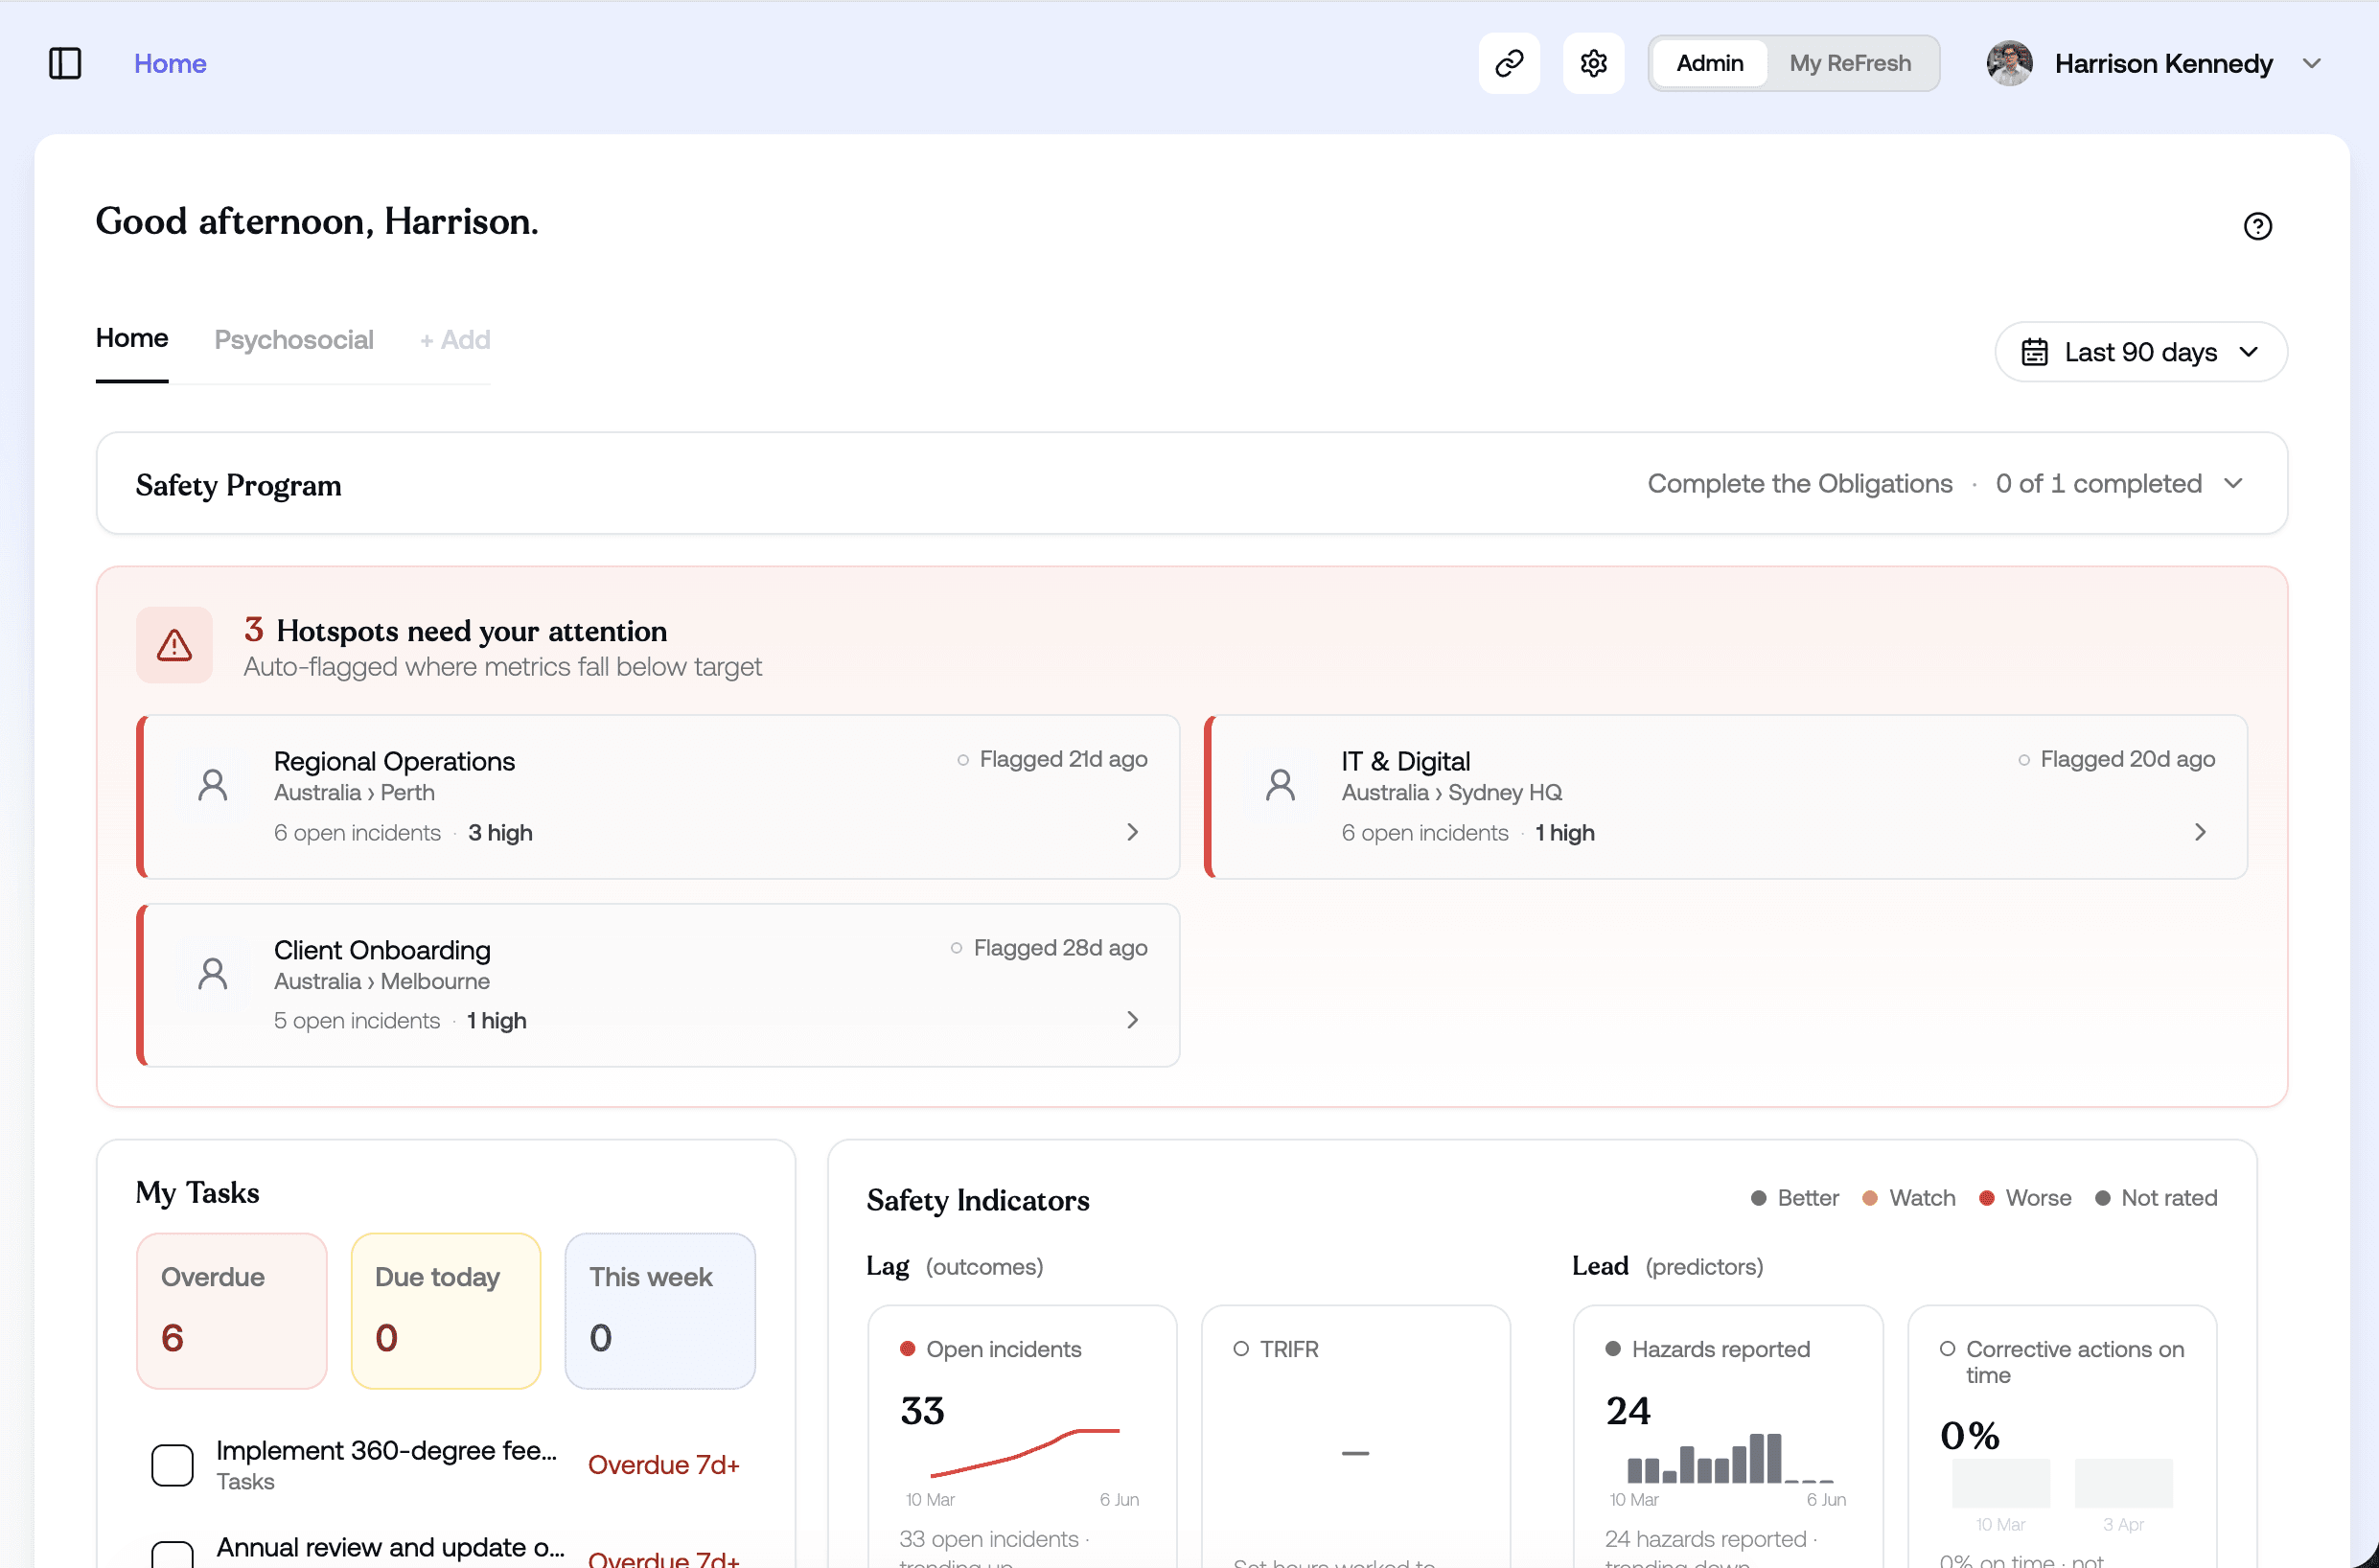
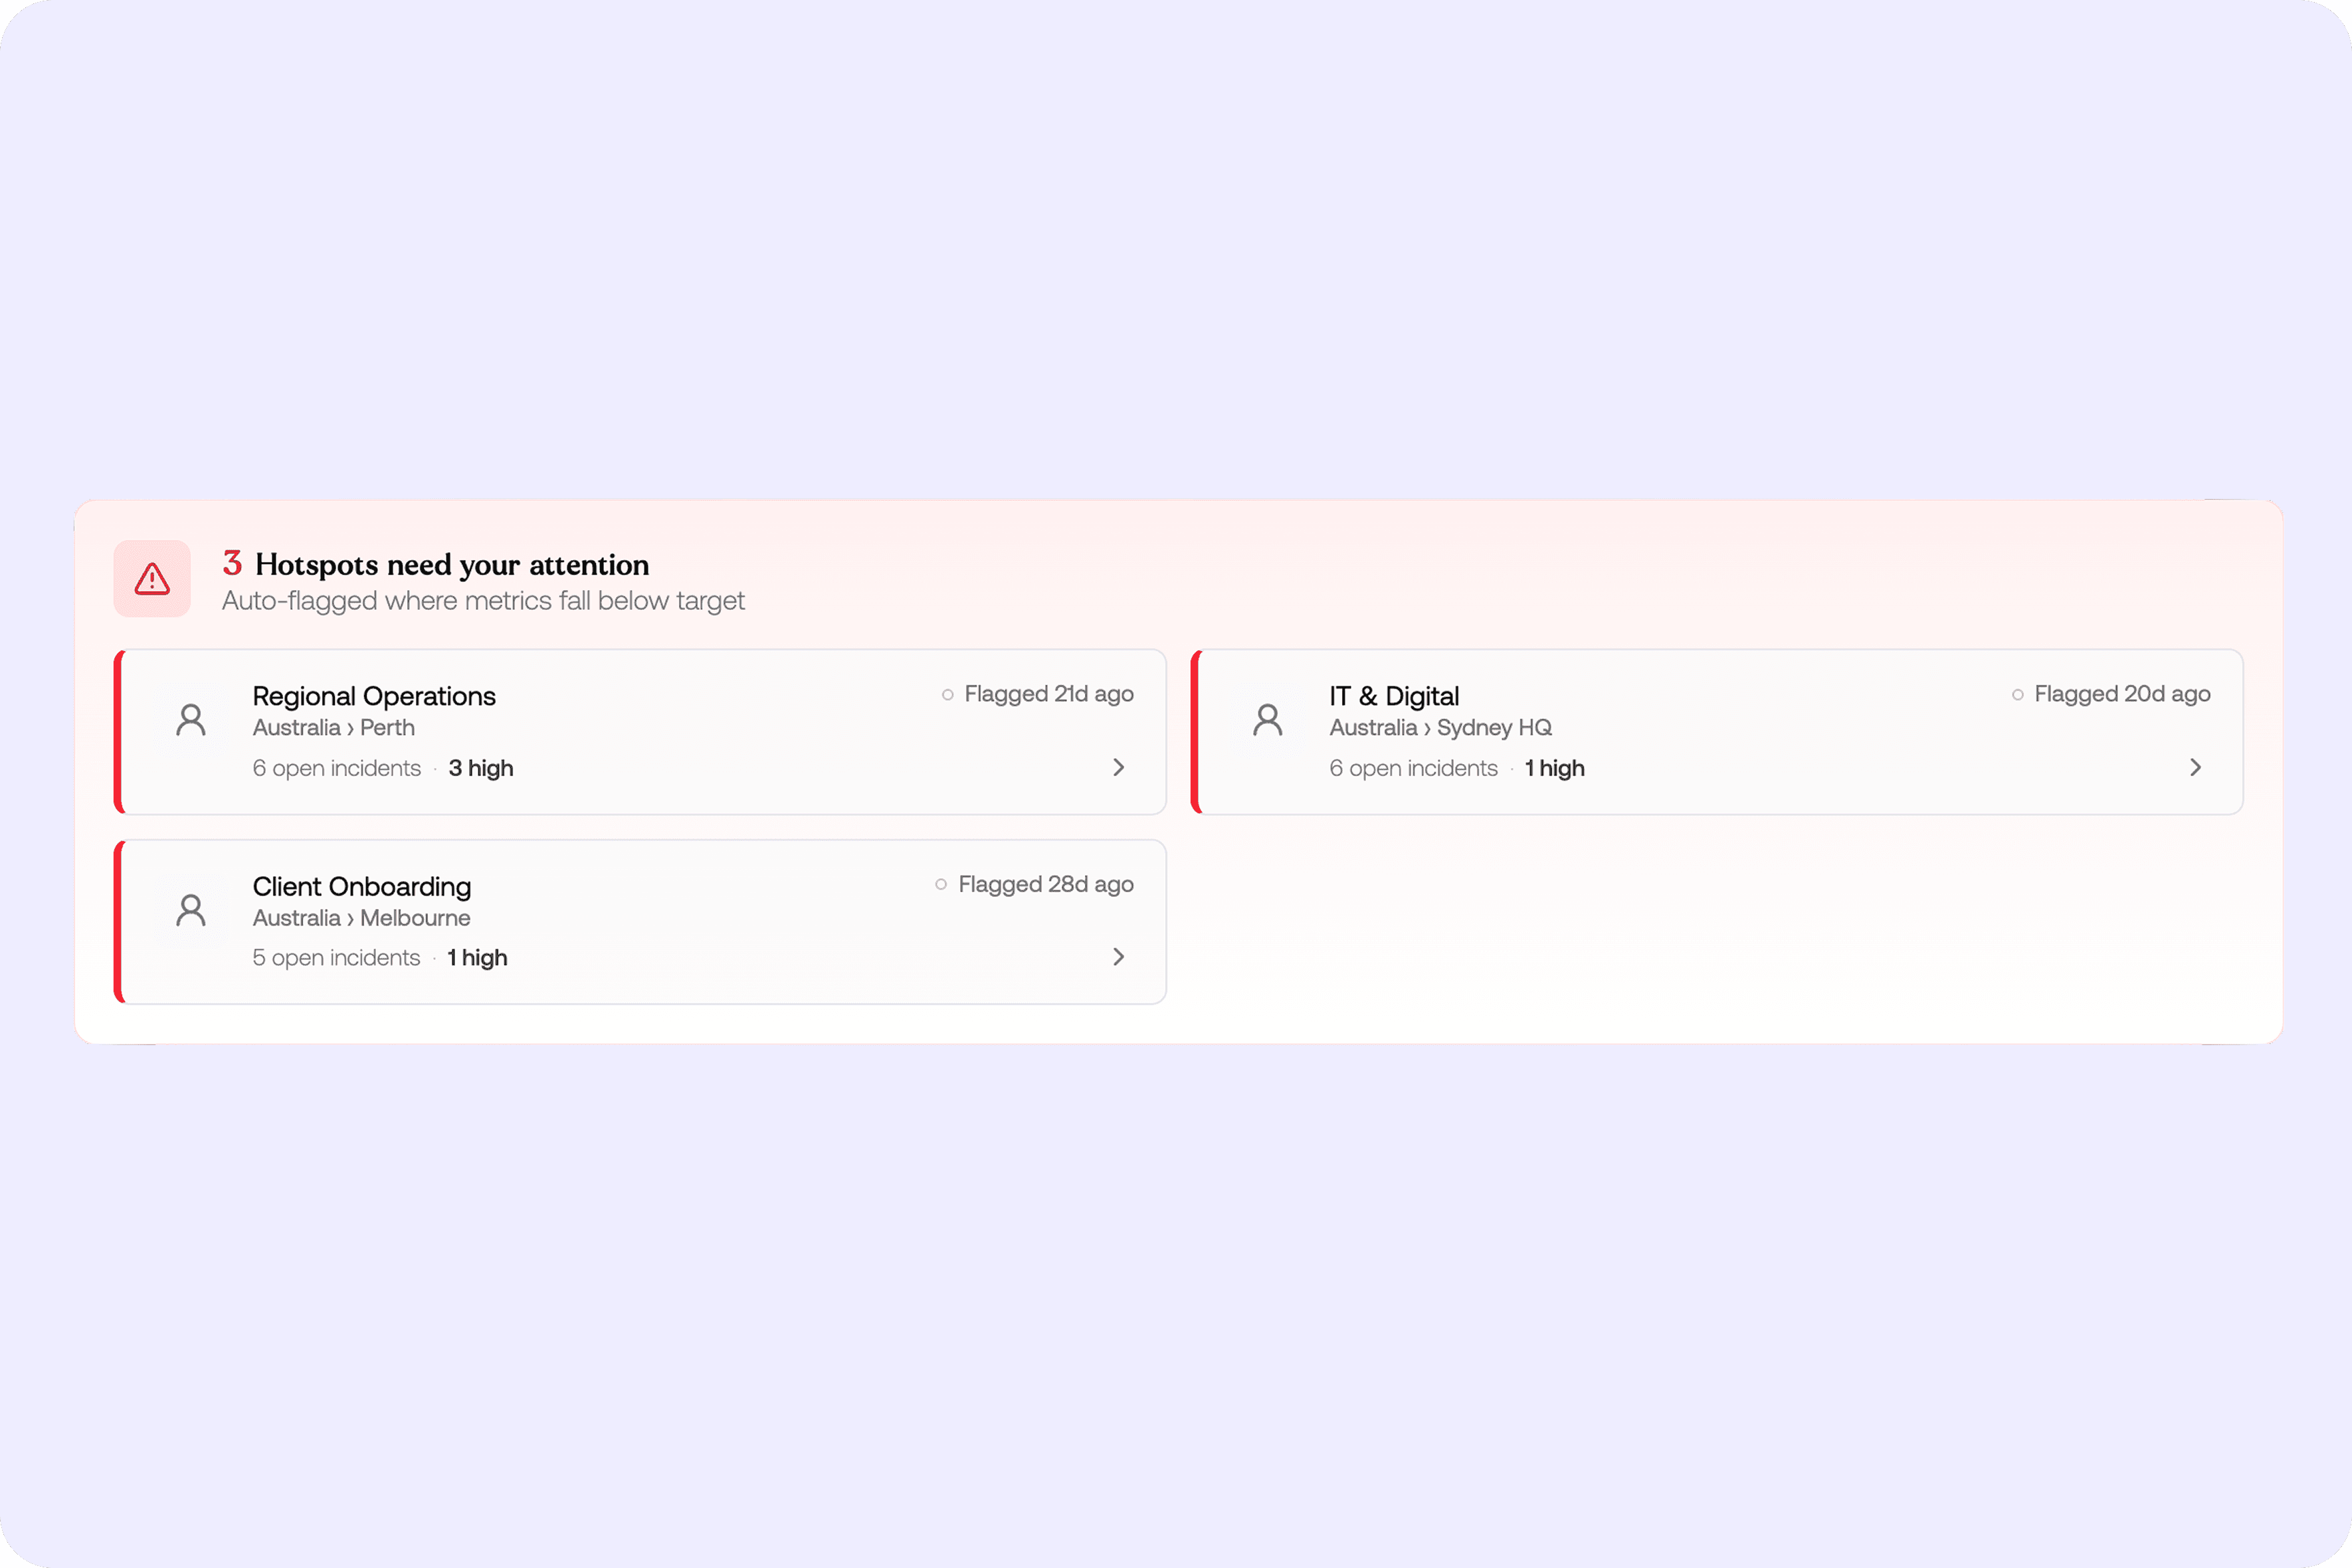
HOTSPOTS
Start with the teams that need attention first
The home view automatically flags hotspots, the groups where metrics fall below target, so leaders see exactly where to look before they go digging through the data.
CONTROL EFFECTIVENESS
See how strong your controls really are
The control effectiveness view shows the distribution of your controls across the hierarchy, how many hazard categories are on target, and the priority gaps, each with the stronger control type that would close it.


WORK FACTOR ANALYTICS
Read risk on two dimensions, not one
Every work factor is scored for the harm it is causing and the protective strength that offsets it, so a high-demand team with strong support reads differently from one without, turning a survey result into a map of where to act.
INCIDENTS DASHBOARD
See incident activity at a glance
The incidents dashboard shows open incidents, severity and status breakdowns and trends over time, so leaders can see where incidents are concentrating alongside the risk and control picture.

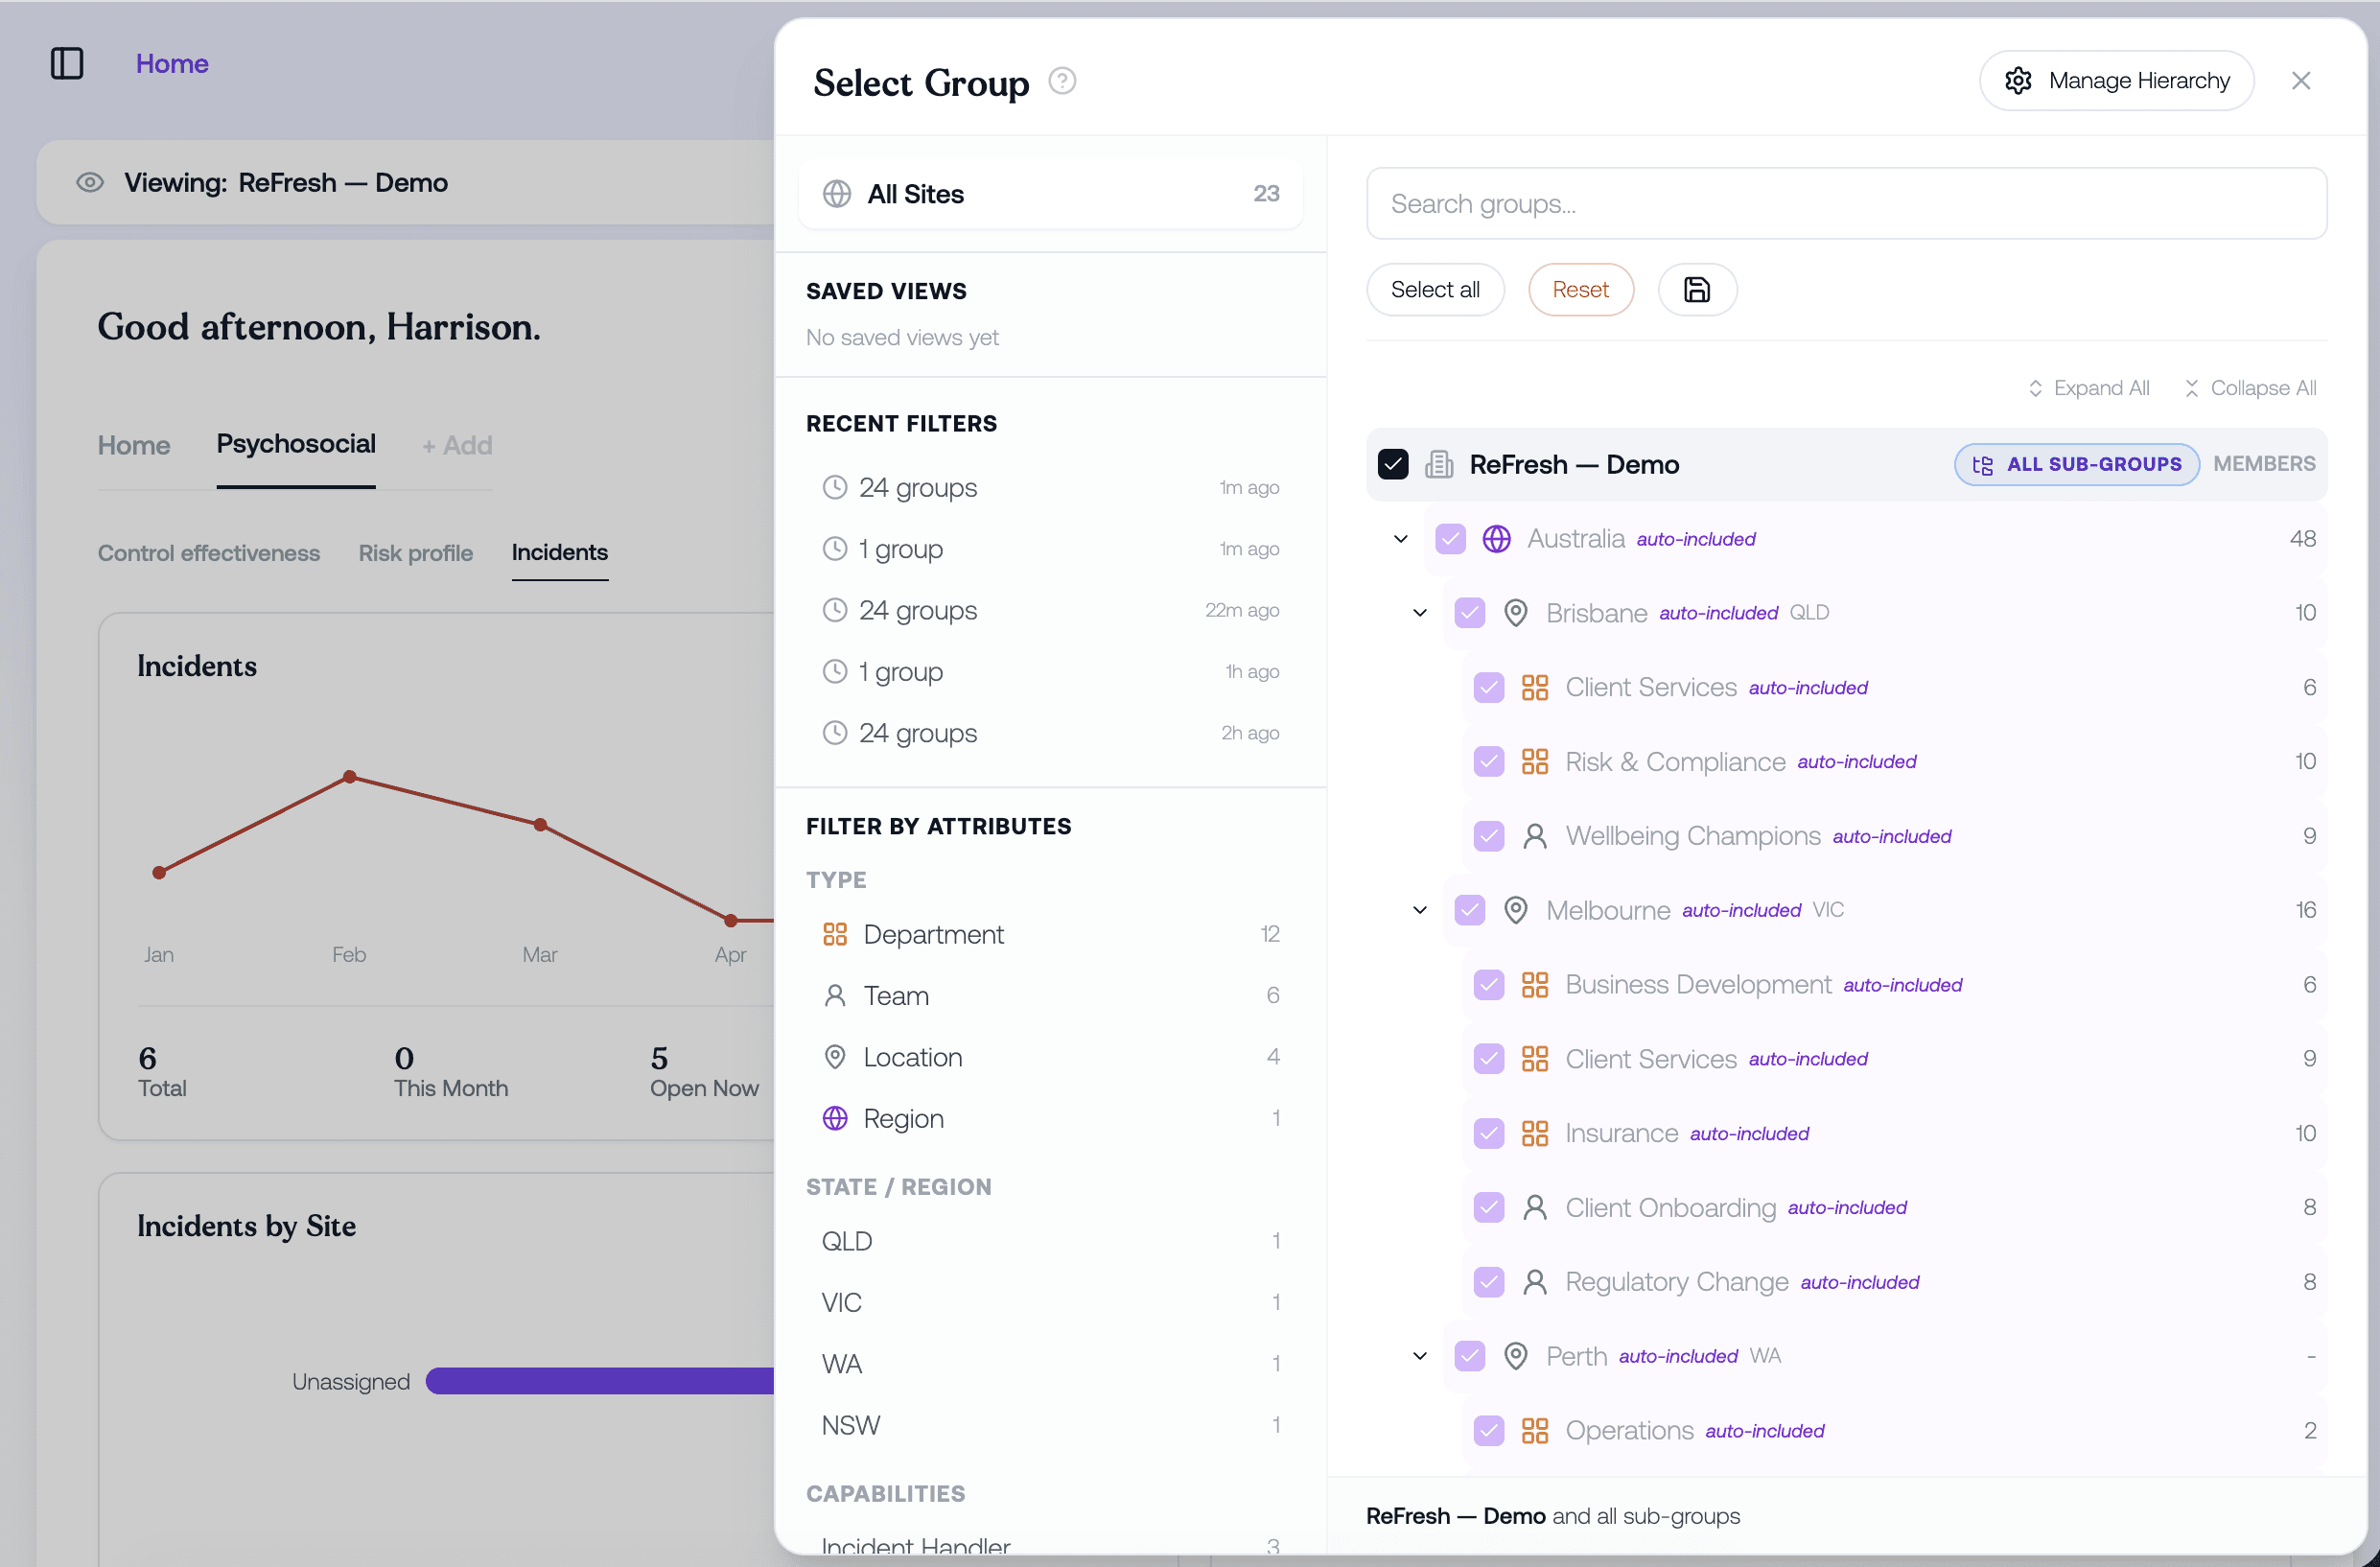
MULTI-SITE ROLLUP
See where risk concentrates across the network
Risk, control and incident data roll up across every site in real time, so a multi-location organisation sees the whole picture in one place instead of reconstructing it from siloed systems.