This lesson walks you through the psychosocial dashboard, which is your operational view of psychosocial risk specifically.
What you'll cover:
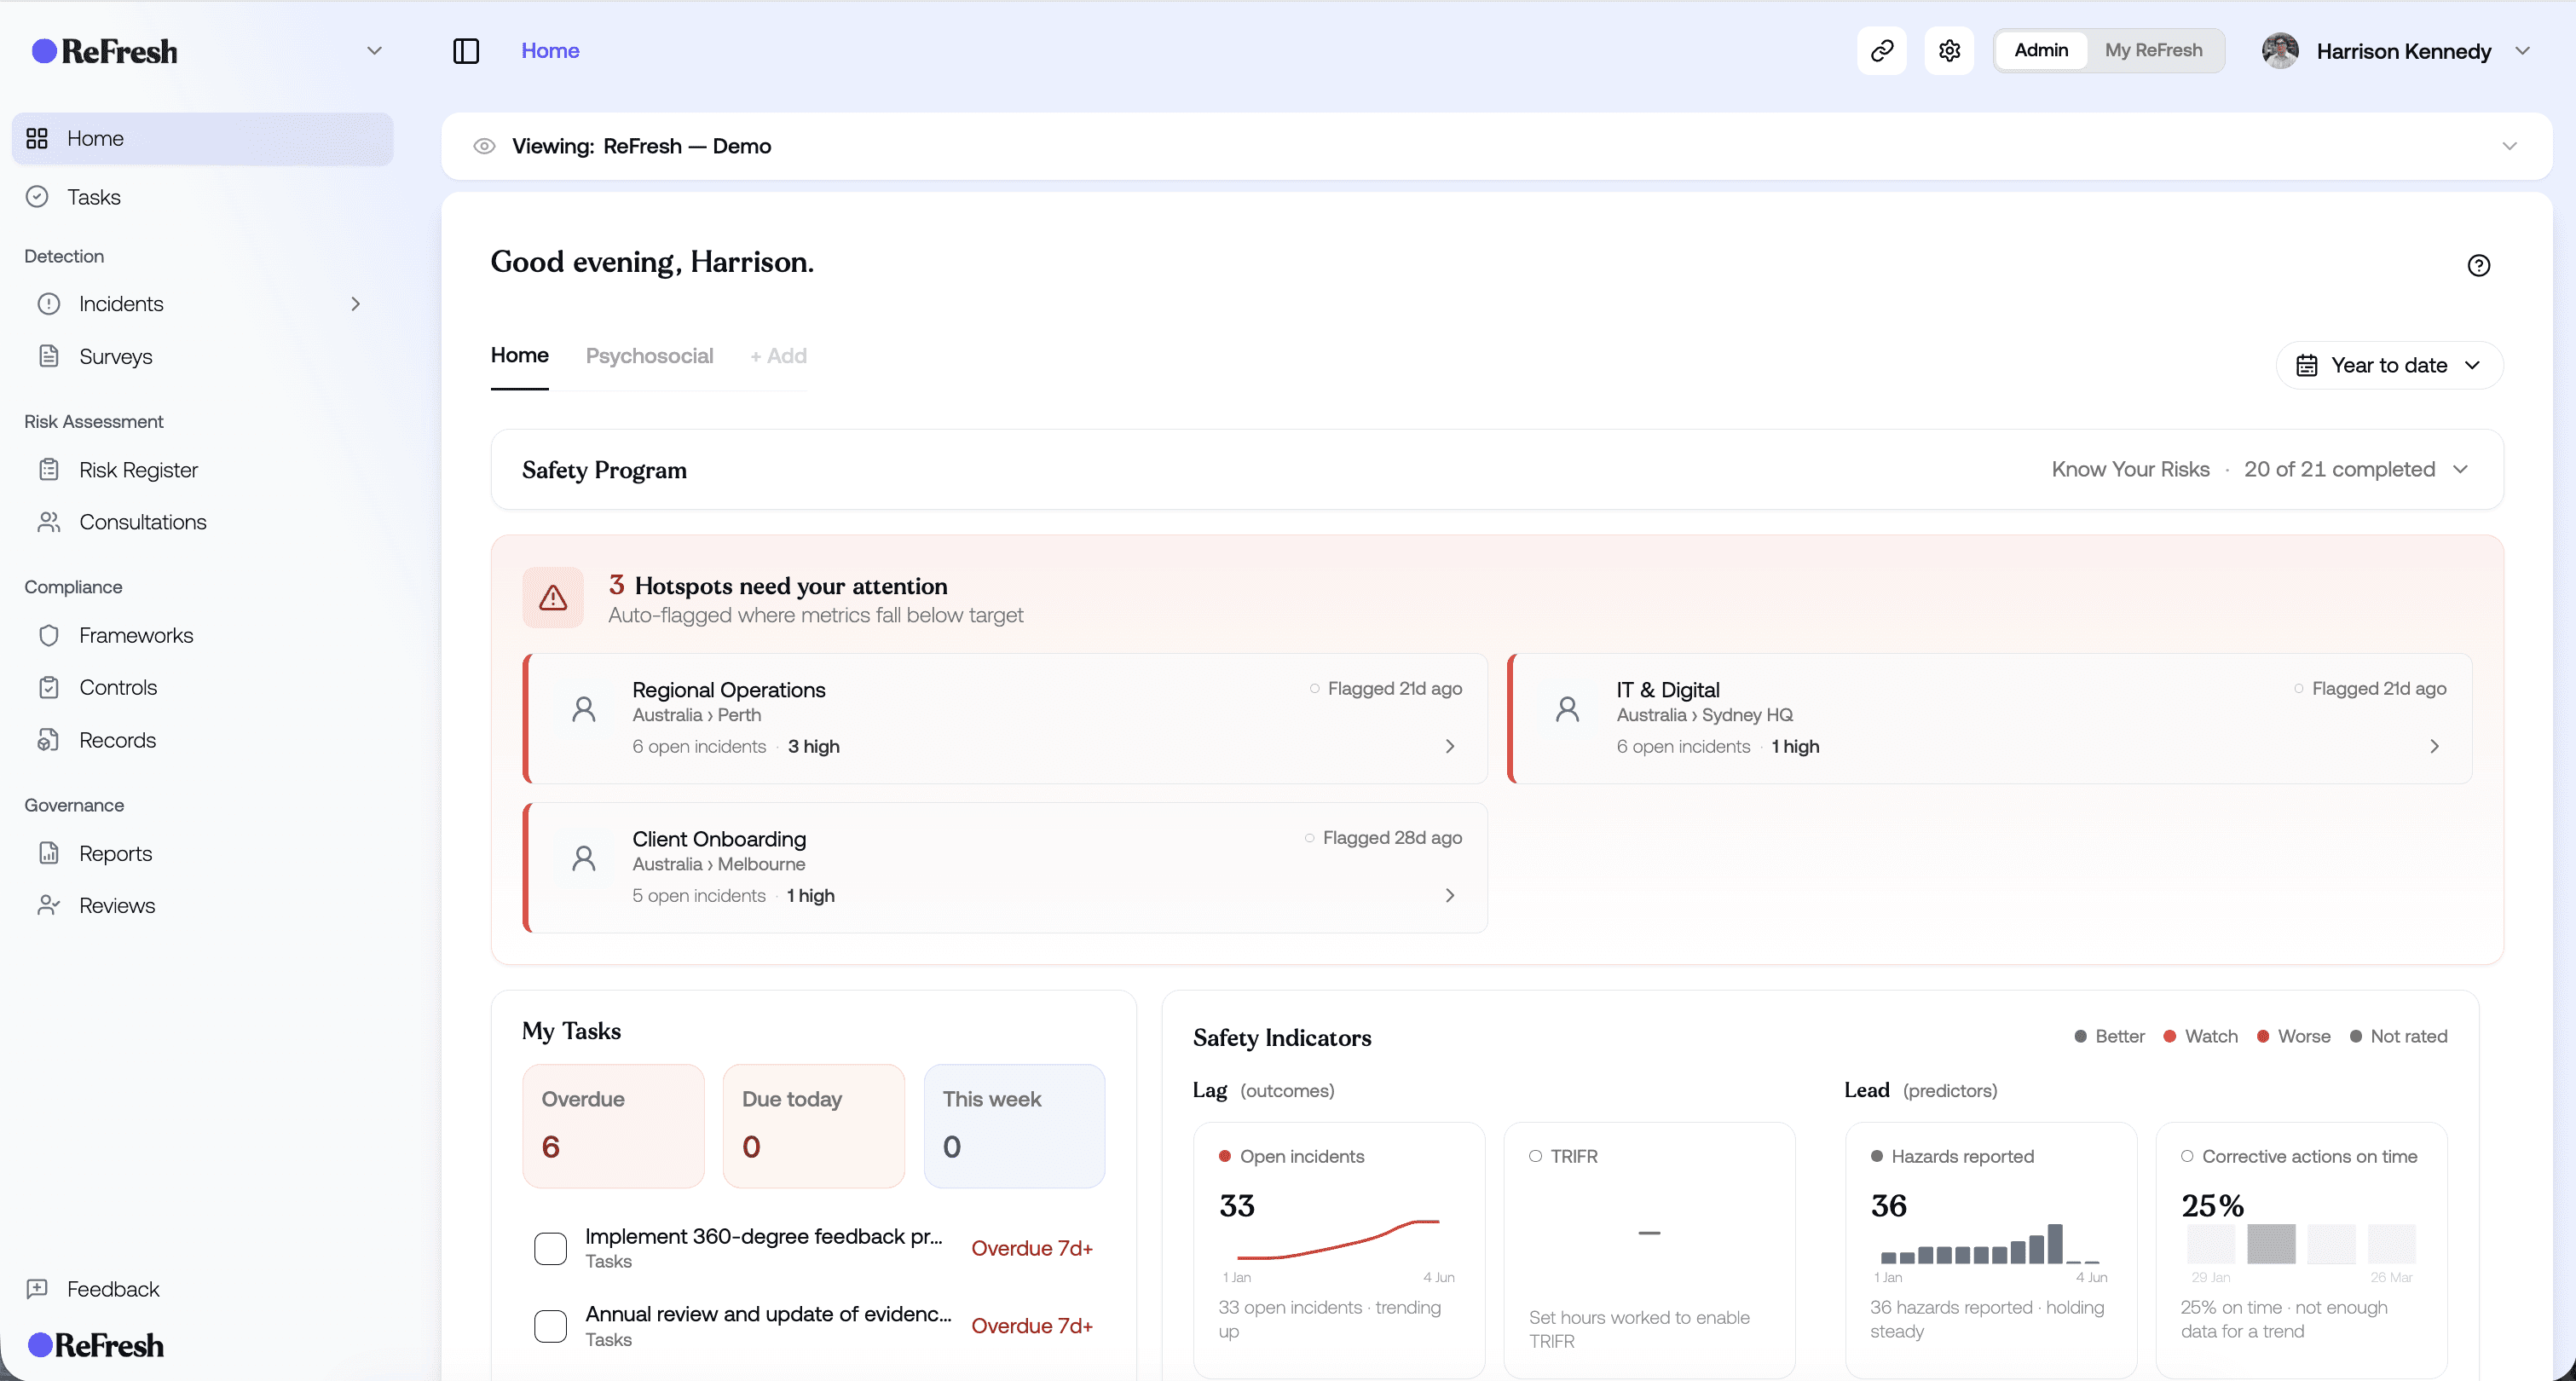
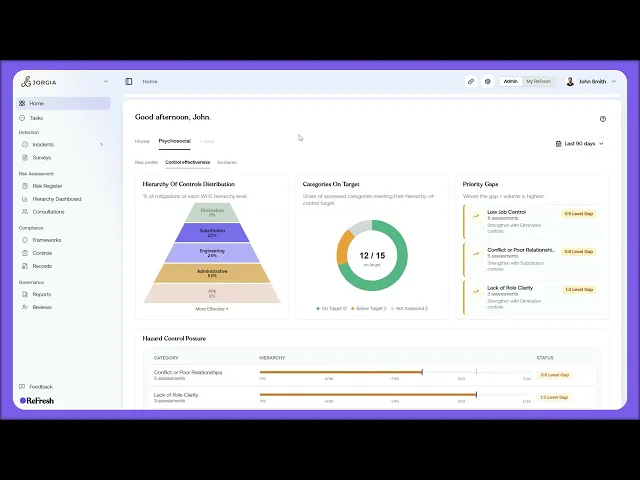
Where it lives. On Home as the second tab. Click Psychosocial and the view switches from the default Home dashboard to one purpose-built around psychosocial risk metrics. Same dashboard structure, different focus.
Psychosocial safety indicators. Tiles showing the direction your risk profile is moving over time, the count of active hazards, the number of completed surveys, response rates, and how effective your interventions have been. Each tile carries a trend line and an On Target, On Watch, or Off Target indicator.
Control effectiveness. A hierarchy of controls roll-up specifically for your psychosocial controls. Shows the percentage of controls sitting at each level. The aim over time is to shift weight away from Administrative and Personal controls and toward Engineering, Substitution, and Elimination.
Drilling in. Hover any chart or hazard category for more detail.
The Incidents tab. Historical incident counts, severity, status, and hazard categorisation. Click into recent incidents below for examples.
Key takeaways:
The Psychosocial tab gives you an operational view of psychosocial risk separate from the default Home dashboard
On Target, On Watch, and Off Target indicators tell you at a glance whether your work is moving the dial
The control effectiveness roll-up shows whether you're shifting toward stronger control types over time